Nonmetro vs. Metro Unemployment Trends
August 4, 2022Through the past several decades and into the recovery from the COVID-19 pandemic recession, the nonmetro and metro areas of Oregon have experienced very different economic trends. In Oregon, statewide unemployment rate trends are tightly tied to trends in the metro areas and in particular, to Oregon’s most populated counties in the Portland metro area. When we break out the unemployment rate of nonmetro and metro areas, we can see how economic experiences vary across the state. When we break the data down by county, we can see an even greater variety of economic experiences.
For this analysis, “metro” is the group of 13 counties that make up Oregon’s eight Metropolitan Statistical Areas (MSAs) and “nonmetro” is the group of 23 remaining counties. MSAs are defined as having at least one urbanized area of 50,000 or more inhabitants and its surrounding county or counties based on population and commuting patterns.
The MSA definition is used due to the breadth of information available at the county level but it is not a perfect representation of Oregon’s urban economies. While it encompasses Oregon’s most urban areas, many counties defined as metro are very rural in character outside of city limits, so some rural attributes are included in metro areas.
Unemployment Rates are Traditionally Higher in Nonmetro Oregon
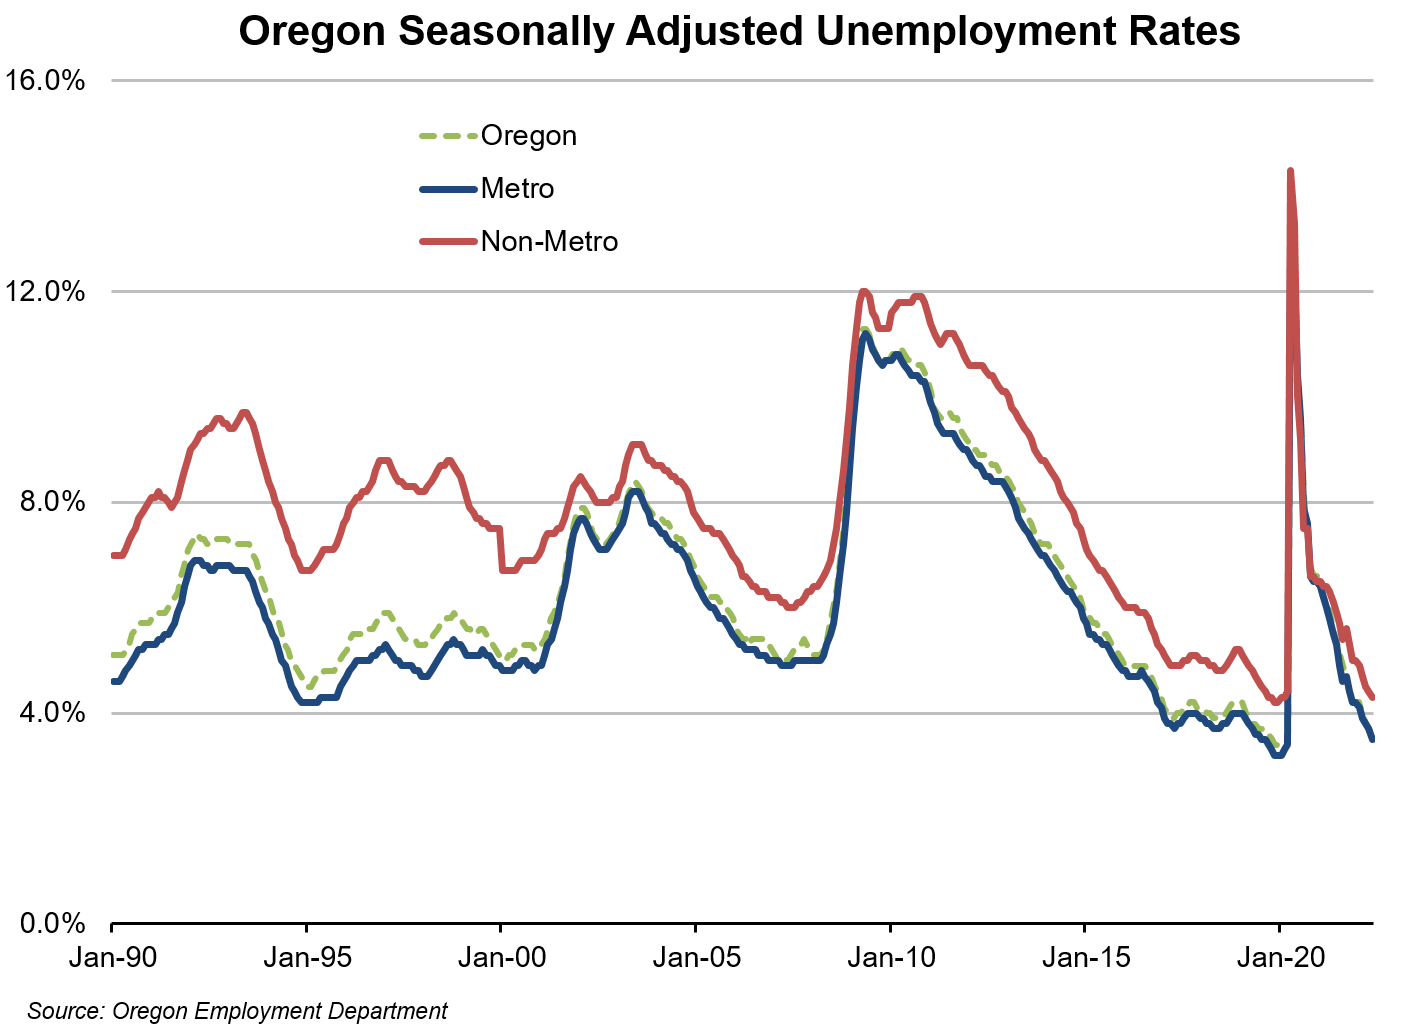
Traditionally, nonmetro Oregon has higher unemployment rates than metro Oregon. This has been the case since at least 1990, the furthest back these data are available. From 1990 to the present, the long-run average unemployment rate for nonmetro Oregon was 7.8 percent, compared with 6.1 percent for metro Oregon.
There are several possible reasons the nonmetro unemployment rate is higher:
- It may be more difficult for workers in rural areas that lose or leave a job to find their next job due to the smaller number of businesses and jobs within commuting distance, which likely means a longer time spent unemployed and seeking that next job, increasing frictional unemployment.
- Rural economies are often dependent on a single business or a certain type of economic activity. If that business suffers, local workers may have difficulty finding a similar job using their skills at another business, leading to increased structural unemployment. Some examples of nonmetro areas that are dependent on a single industry include communities reliant on wood products and those that are dependent on the tourism related leisure and hospitality industry.
- A larger share of nonmetro economic activity is based on seasonal agriculture and resource extraction industries, leading to a higher degree of seasonal unemployment in these local economies.
Trend data shows that the gap between the unemployment rates of nonmetro and metro Oregon has narrowed over time. Back in the 1990s, nonmetro unemployment rates were often 3 to 4 percentage points above the level in the state’s metros. Early in the 2000s, metro areas were significantly impacted by the bursting of the dot-com bubble, which was particularly acute in Oregon’s largest metro area, Portland-Vancouver-Hillsboro. At that point, nonmetro unemployment rates converged with the metro rates, bringing nonmetros within a percentage point of the metro unemployment rate.
The subsequent Great Recession caused the gap to widen somewhat as metro unemployment rates remained higher for a longer time during recovery. By 2012, the gap had widened to 2 percentage points. The recovery from the Great Recession was one of the longest in history and both nonmentro and metro Oregon reached record low unemployment rates in late 2019. The gap once again narrowed to about 1 percentage point. One possible reason the gap narrowed may be that nonmetro counties generally have older populations than metro counties and retirements can keep unemployment rates down since, when people retire, they are not counted as unemployed but often leave an opening that needs to be filled.
 Pandemic Restrictions Affect Unemployment Rates
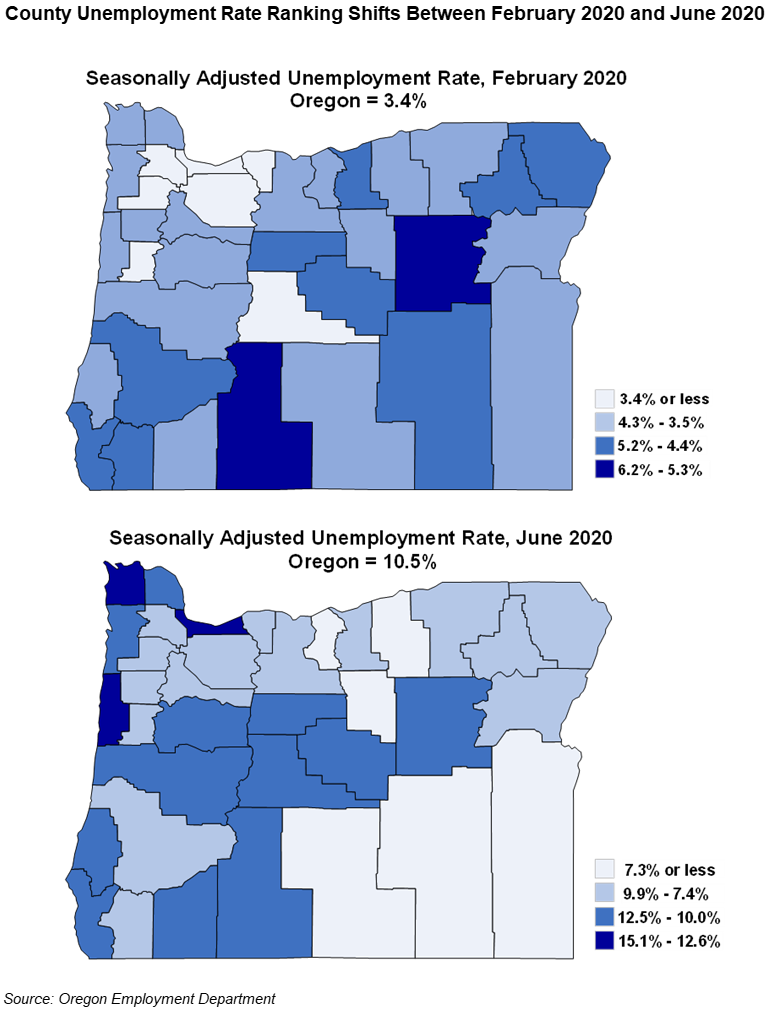
In late February 2020, Oregon had its first presumptive case of COVID-19. Confirmed cases mounted rapidly and on March 23, the governor declared a statewide stay-at-home order. The order expanded the list of businesses forced to close to those “for which close personal contact is difficult or impossible to avoid,” including gyms, gift shops, malls, senior centers and theaters, among others. Restaurants and bars had been closed by a previous order except for take-out orders. Because of the closures, both nonmetro and metro areas reached record high unemployment rates in April 2020 of 14.3% and 12.8%, respectively.
All of Oregon’s 36 counties experienced over-the-month increases in April 2020. Counties with a high concentration of jobs in the leisure and hospitality industry had the highest rate increases. Nonmetro Lincoln County had the largest increase of 19.2 percentage points to reach a 23.4% rate. However, three of the top 10 counties with the largest increase – Deschutes (12.4 percentage points), Multnomah (11.0 percentage points), and Lane (10.0 percentage points) – are metro counties. All of the 10 counties with the smallest increase were nonmentro counties, except for Benton County.
On May 7, the governor released details on a three-phase reopening centered on counties. Counties would have to meet metrics based on testing, tracing, and declining COVID-19 cases. The first phase allowed restaurants and bars to open for dine-in. Personal services such as hairdressers and fitness centers and stand-alone retail were allowed to reopen contingent upon compliance with state guidelines.
On May 15, 31 of Oregon’s 36 counties were allowed to enter Phase 1. Oregon’s largest counties – Multnomah, Clackamas, and Washington – had yet to apply and the Salem MSA counties of Marion and Polk were initially denied.
The Salem MSA counties entered Phase 1 reopening on May 22 and Clackamas County entered Phase 1 reopening on May 26. Multnomah County finally entered Phase 1 on June 19. Meanwhile, 26 counties had entered Phase 2 by then, which allowed larger gathering size, some office work, and visitation to congregate care.
While all county-level unemployment rates increased, the relative ranking from highest to lowest shifted. The timing of reopening and a county’s relative share of employment in the leisure and hospitality industry caused a shift to lower unemployment rates in nonmetro counties, especially in Eastern Oregon, and to higher rates in metro counties, especially in Western Oregon.
 Metro unemployment rates remained elevated into the second half of 2020 for several reasons. First, the delayed opening of counties in the Portland and Salem metro areas kept employment growth down. Second, the Corvallis and Lane metro areas are home to major universities that were affected by school closures and a switch to virtual learning. Finally, the Bend metro area has a large concentration of employment in the leisure and hospitality industry, causing it to have a large unemployment rate increase. Meanwhile, all nonmetro areas were reopening. The nonmetro counties on the coast with high unemployment rates have relatively small labor forces that have little effect on the overall nonmetro rate. Because of this dynamic, in the second half of 2020, the nonmetro unemployment rate was lower than the metro rate for the first time in the history of the data, which began in 1990.
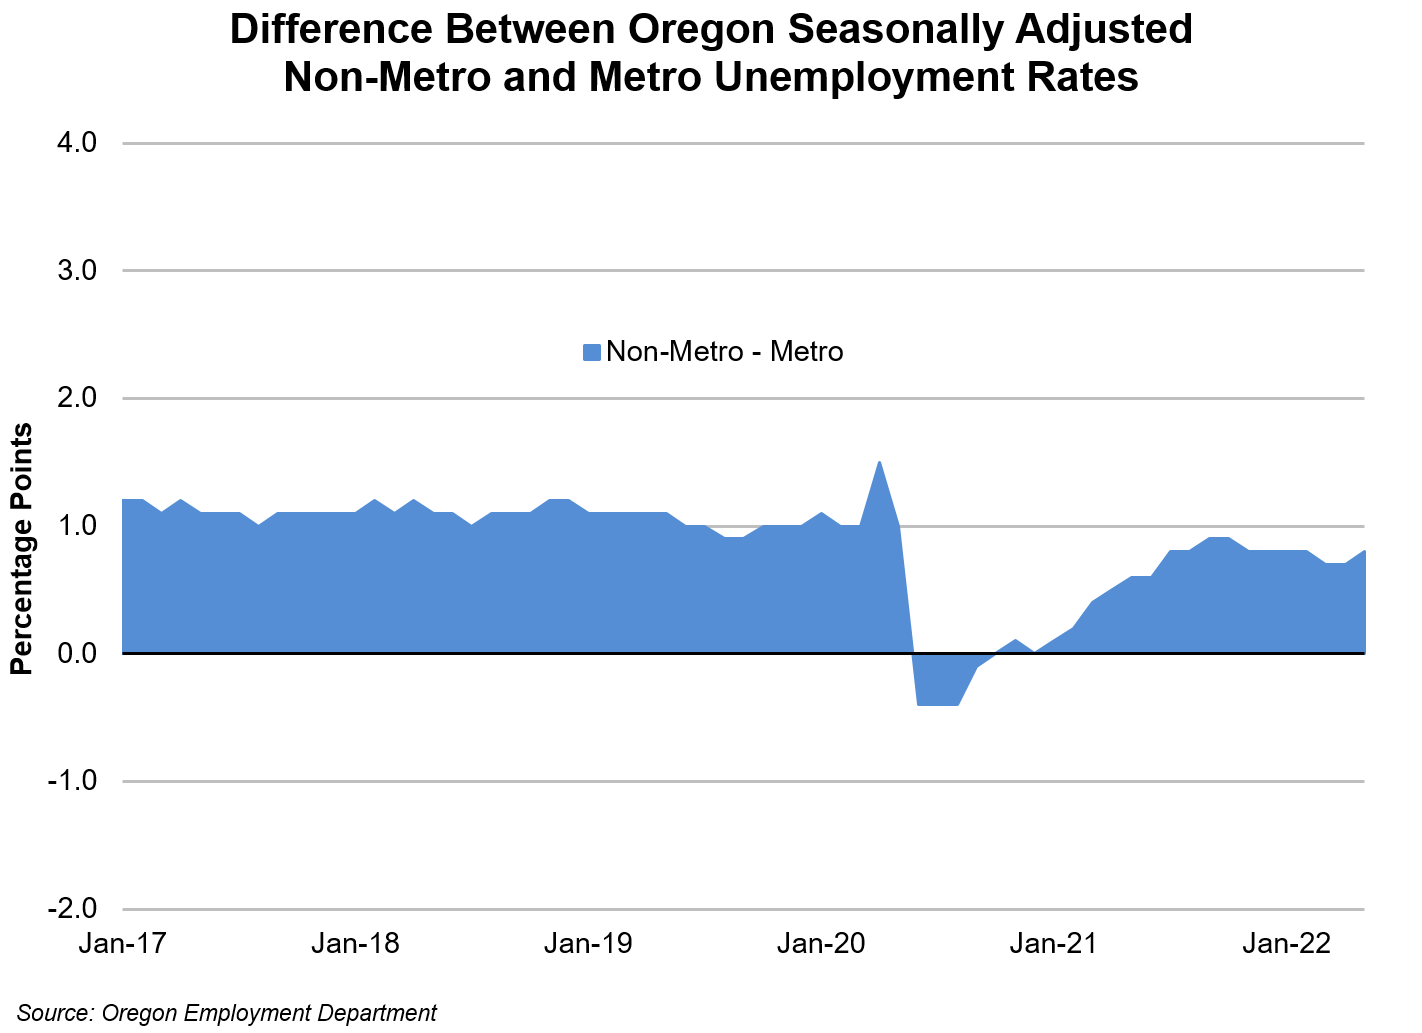 As of the writing of this article, the recovery from the pandemic recession is in full swing and the nonmetro unemployment rate is again higher than the metro rate. Some areas are struggling to reach pre-pandemic levels of employment but most counties are at or near record low unemployment rates again. The gap between nonmetro and metro unemployment rates is almost back to the prepandemic level of around 1 percentage point. Going forward, several factors could affect the difference between unemployment rates. Continued retirements may help keep nonmetro rates low. Additionally, remote work may help the economy of some nonmetro counties, helping to lower unemployment rates.