Oregon’s Natural Population Continued to Decrease in 2022
June 9, 2023In 2022, Oregon’s population increased by 18,270 to 4,281,851 according to Portland State University’s Population Research Center. This marked growth of 0.4% over the year and 1.05% since the 2020 Census.
Population change results from either natural population change or net migration. Natural population change refers to the difference between births and deaths in a given year. Natural population increases if more births than deaths occur or vice versa. Net migration refers to the difference between how many people move into and out of an area in a given time. A positive value of net migration means more people moved into an area than left it, while a negative value indicates the opposite.
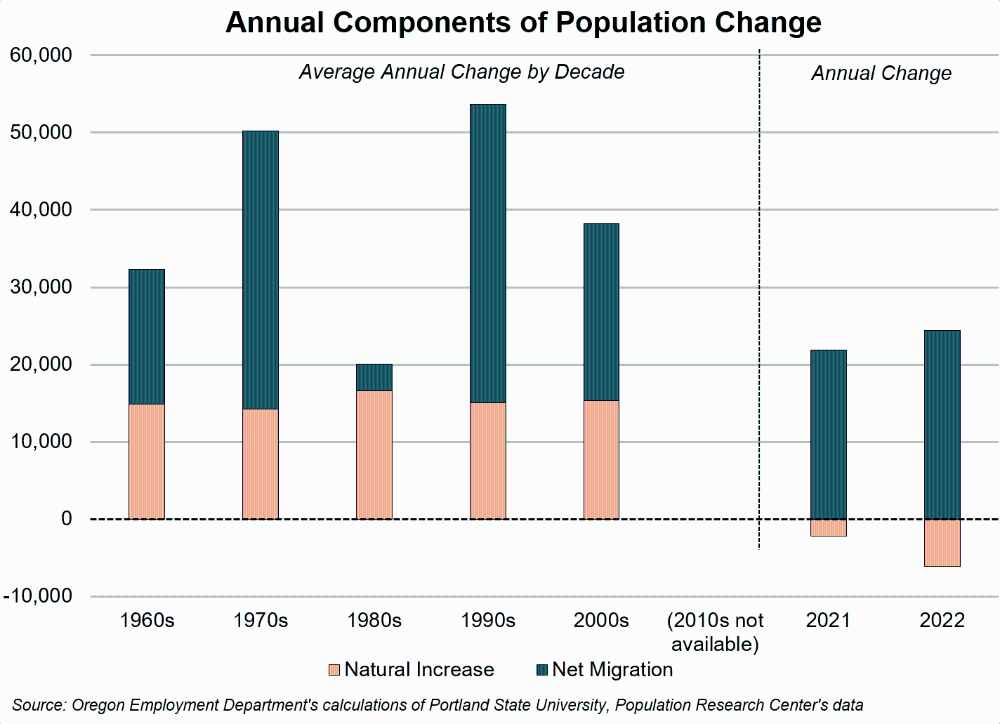
Oregon continued to have more deaths than births in 2022, leading to an annual natural population loss of 6,128. The natural loss was caused by a record number of deaths (46,259). This represents the lowest natural population growth since comparable records began in 1960 and the only year besides 2021 with a natural population loss. Before 2021, Oregon had fairly consistent average annual natural population increases of about 15,000.
Oregon Continues to Attracts Migrants, Offsetting Natural Population Decline
Given the natural population decline, all of Oregon’s population increase in 2022 was due to net migration. Oregon gained 24,398 migrants over the year. This net migration increase was very close to the long-term average since the 1960s.

Unlike natural population change, Oregon’s net migration has varied considerably over the last half-century depending on economic conditions. In general, net migration increases as the economy expands and more jobs become available and decreases as the economy contracts. The decade with the lowest average net migration was the 1980s, when Oregon experienced a deep economic downturn.
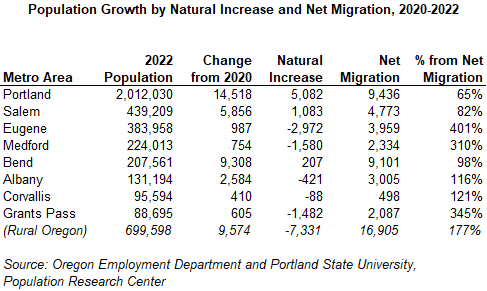
Similar to Oregon as a whole, an influx of migrants has been able to offset natural population decline in Oregon’s metropolitan areas. Between 2020 and 2022, metro areas saw net in-migration of 35,192 which accounted for 67% of total net migration in the state.
Metro areas in Oregon grew 1.0% between 2020 and 2022. Rural areas grew slightly more at a rate of 1.4%. Around 84% of Oregonians lived in metro areas in 2020. This was unchanged in 2022.

Population Declines in Three Oregon Counties
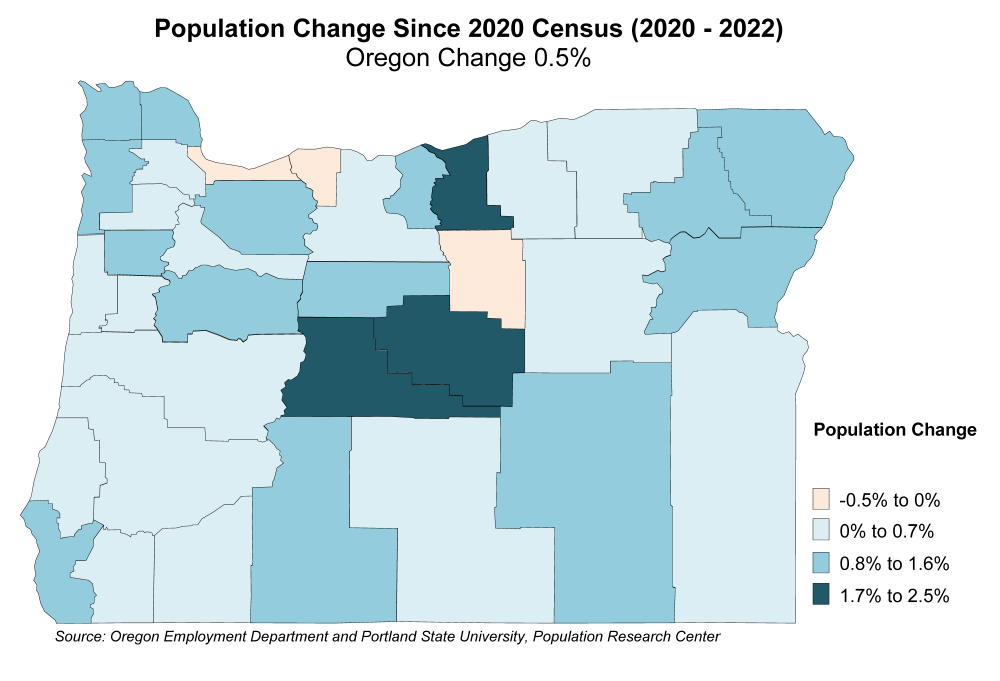
Three Oregon counties lost population between 2022 and the 2020 census. Hood River, Wheeler, and Multnomah Counties lost 0.2%, 0.3% and 0.5% of population, respectively. Note that Wheeler County is a rural county with a relatively small population so even minor population changes can shift percent changes. The total decline was due to 15 more deaths than births.
Hood River and Multnomah counties were the only two counties in Oregon to have negative net migration between 2020 and 2022. Hood River lost 147 more people than it gained. Multnomah County lost 6,764.

Oregon’s counties mostly mirrored the demographic trends in the state as a whole. In general, counties had a natural population decline which was offset by positive net migration. Out of 36 counties, only nine had a natural population increase between 2020 and 2022. These counties were Deschutes, Hood River, Marion, Morrow, Multnomah, Polk, Sherman, Umatilla, and Washington counties.
Counties with younger populations tended to have greater natural population increase. The nine counties that had a natural increase in population were home to 51% of Oregon’s total population, but only 43% of the population 65 and over. The average share of the population 65 and over in these nine counties was 18%. In contrast, the average share 65 and over of the counties with a net population loss was 25%. The disproportionately small share of people 65 and over was a contributing factor to the net population increase in these nine counties.
Population Estimates by Age and Sex
The Population Research Center at Portland State University prepares annual population estimates for Oregon and its counties by age and sex, and incorporated cities and towns as of July 1 each year. These estimates serve as the official population numbers between each decennial Census, and are used to disburse state revenues to Oregon counties and cities.
To explore and use population estimates data for 2022 and prior years for Oregon and its counties, visit https://www.pdx.edu/population-research/population-estimate-reports.