2022 Rogue Valley Local Area Personal Income
December 14, 2023New figures published from the Bureau of Economic Analysis show healthy gains in Oregon and South Coast per capita personal income (PCPI) between 2021 and 2022. PCPI is just one of the figures recently released in the State and Local Area Personal Income series available now for 2022 at www.bea.gov.
PCPI is one of the most often cited figures to measure an area’s overall economic health and prosperity. But there are a few factors that make this an imperfect yardstick to compare local areas and economies. Since the data use total income – earnings from work; personal current transfer receipts; and dividends, interest, and rent – and divide that by total population, areas with a higher concentration of older residents can show lower PCPI. The reason is that as people leave the labor force, they have likely passed their peak earning years, and therefore have less contribution to the net earnings component of income. Remember PCPI represents income, rather than wealth. Older residents may have substantial wealth, but not have as much relative income, and this wealth would not be captured in PCPI figures, unless it was income-generating investments that would show up in the “dividends, interest, and rent” portion of PCPI. Just as we’ve seen corporate profits rising much faster than average U.S. worker wages, faster growth in overall economic output doesn’t necessarily mean equally fast growth in per capita personal income.
Another limitation of comparing local economies using PCPI as a yardstick is that there is no accounting for the differences in cost-of-living among local areas. Places with lower cost of living and lower PCPI can be relatively as well-off as areas with higher cost of living and higher PCPI. Knowing the limitations of the data can help you understand how to view the figures in a clearer context.
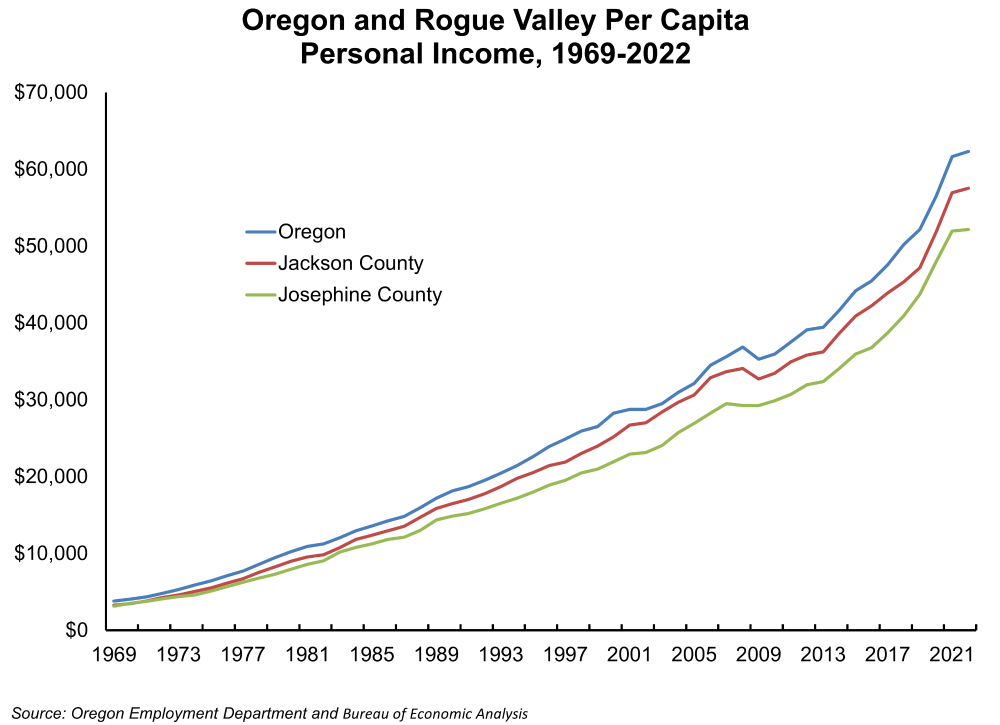
In 2022, Jackson County’s PCPI was $57,552 which was an increase of 1.1% from 2021 and was the 899th highest PCPI among 3,114 U.S. counties. Josephine County’s PCPI was $52,166, also growing, and up 0.4% over the year. Jackson County’s PCPI increased similarly to Oregon statewide (1.1%) and the U.S. increase (1.6%), while Josephine County’s gain was a bit slower. Jackson County’s PCPI was 92% of the statewide PCPI and 88% of the U.S. average per capita personal income. Josephine County’s PCPI was 84% of the state average and 80% of the U.S. PCPI figure in 2022.
About 52% of Jackson County’s personal income is from net earnings, which includes wage and salary income, farm, and non-farm proprietor income. In Josepine County, 47% of personal income was from net earnings. The Rogue Valley’s net earnings share of personal income was a little lower than for the United States (62%) or Oregon statewide (60%). Average earnings per job in Jackson County were $60,435 compared with $71,601 for Oregon as a whole. Josephine County’s net earnings per job was $55,824. Average nonfarm proprietor income in Jackson County exceeded the Oregon average, at $37,348 versus the state’s $36,959. Non-farm proprietor income was higher in Josephine County, at $48,996 in 2022.

Per capita personal current transfer receipts made up about 18% of U.S. personal income, 27% in Jackson County, and 36% in Josephine County. About 90% of the Rogue Valley’s personal current transfer receipts were from “retirement and other income,” reflecting our slightly older population with more retirees than the state overall. Both Jackson ($14,011) and Josephine County ($16,760) had higher per capita retirement and other income than Oregon ($11,660). Jackson ($1,454) and Josephine County ($1,680) also had greater per capita “income maintenance” than the Oregon average ($1,229).
Dividends, interest, and rent income accounted for about 21% of Jackson’s personal income in 2022, just slightly more than the share for the U.S. Dividends, interest, and rent accounted for 17% of Josephine County personal income, compared with 20% for the U.S. Since the late 1960s, Jackson County’s PCPI gap with Oregon has ranged between about 14% to a low of -4% in 2003 since the late 1960s. In 2022, the gap between Jackson and Oregon’s PCPI was -$4,751 or -8% below Oregon’s PCPI figure. Josephine County’s PCPI has roughly paralleled Jackson’s over the years, with Jackson County PCPI income running between about 10% to 15% greater than Josephine’s since the mid-1980s.
There are many other data and statistics available from the State and Local Personal Income series published by the Bureau of Economic Analysis. For more information, visit the website at www.bea.gov and explore the interactive tables, maps and other data.