Employment Among Oregon’s Veterans
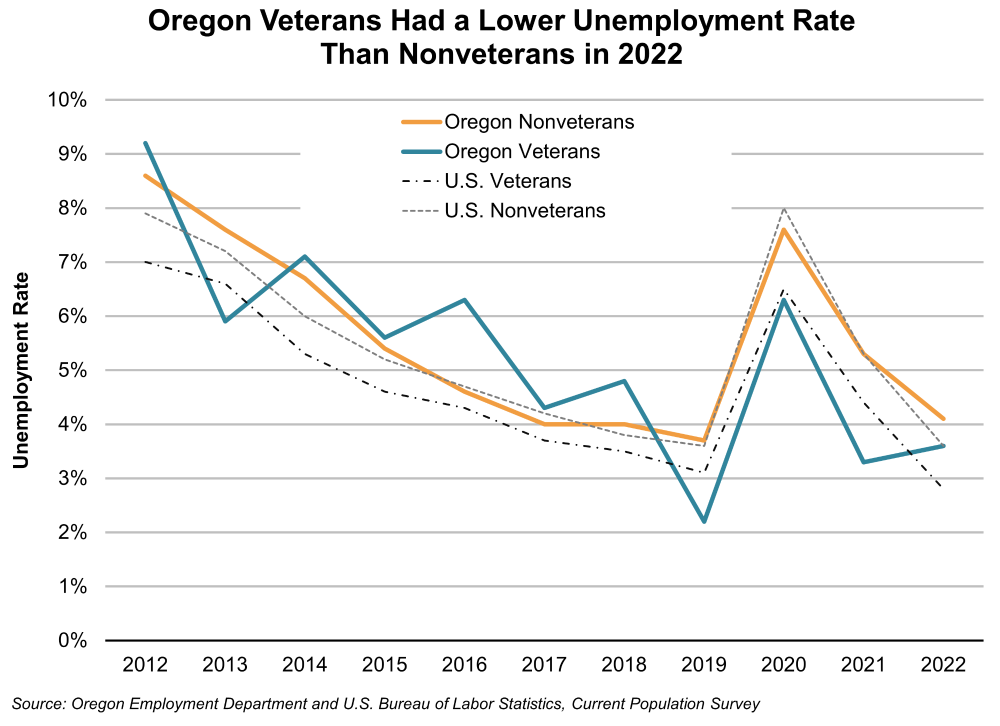
October 31, 2023The unemployment rate for Oregon veterans was 3.6% in 2022, according to the Current Population Survey. This rate was lower than the unemployment rate for nonveterans, which was 4.1% in the same period. In the U.S. more broadly, veterans had a lower unemployment rate than their Oregon counterparts at 2.8%.

About 252,000 veterans lived in Oregon in 2022. The American Community Survey estimates that 72.1% of veterans ages 18 to 64 were in the labor force in 2022. This labor force participation rate was lower than nonveterans in Oregon (78.4%) and veterans nationally (77.1%).
In 2022, Oregon’s veterans earned a higher median income ($47,197) than nonveterans ($38,358), despite being less likely to have a college degree. Among Oregon veterans aged 25 years and older, 29.6% have a four-year degree or higher, compared with 37.0% of nonveterans. Alternatively, 4.1% of veterans didn’t have a high school diploma, as opposed to 8.8% of nonveterans.
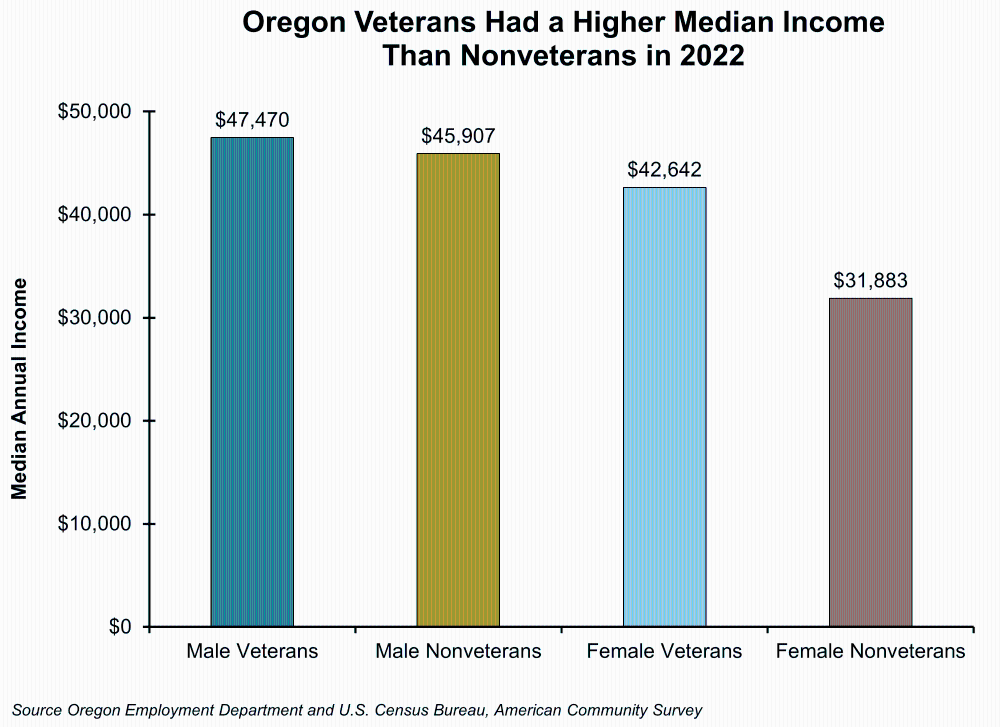
Female veterans, who represented 8.3% of Oregon’s veterans in 2022, earned a median income of $42,642. That’s less than male veterans’ median of $47,470, but higher than female nonveterans’ income of $31,883.

Veterans were more likely to have a disability, but slightly less likely to be in poverty than the general population. Around 36% of veterans ages 18 years and older had a disability in 2022, more than double the rate for nonveterans (16.9%). In the same period, however, 9.2% of veterans lived below the poverty level, below the 11.9% poverty rate among nonveterans. Of the Oregon veterans living in poverty, 43.7% reported having a disability. Among veterans above the poverty line, only 35.2% had a disability.
More than half of Oregon’s veterans were age 65 years or older and served in the military at least four decades ago during the Vietnam War (94,802 veterans), Korean War (11,508), or World War II (2,633). Veterans who served in the First and Second Gulf Wars totaled 104,649.
Only 8.0% of Oregon veterans were under the age of 35 in 2022, compared with 29.8% of nonveterans. This older age profile may partially explain why veterans have a lower labor force participation rate, a higher median income, and higher disability rates than nonveterans.
In 2020, the U.S. Census Bureau launched Veteran Employment Outcomes, an online tool for examining labor market outcomes for recently discharged Army veterans. Tabulated by military specialization, service characteristics, employer industry, and demographics, the interactive tool allows for comparing veteran wages across different factors. The tool can be accessed at https://lehd.ces.census.gov/applications/veo.
More information about veterans is available in the U.S. Bureau of Labor Statistics’ “Employment Situation of Veterans”.