Oregon Gross Domestic Product – A Measure of the Economy
July 18, 2023In another sign of the strong economic rebound following the Pandemic Recession in 2020, Oregon’s gross domestic product (GDP) growth ranked ninth fastest in the country in 2022. GDP is composed of goods and services produced for sale in the market and measures the monetary value of final goods and services – that is, those that are bought by the final user and produced in a country or geographical area in a given time period.
GDP counts all of the output generated within the borders of a country or geographical area and also includes some nonmarket production, such as defense or education services provided by the government. GDP is important because it gives information about the size of the economy and how an economy is performing.
Real Versus Nominal GDP
Because GDP is collected at current, or nominal, prices, it often makes sense to adjust for inflation when comparing GDP values over time. To determine “real” GDP, its nominal or current value must be adjusted to take into account price changes to allow us to see whether the value of output has gone up because more is being produced or because prices have increased. A statistical tool called the price deflator is commonly used to adjust GDP from nominal to constant or real prices.
Historical Real GDP in Oregon
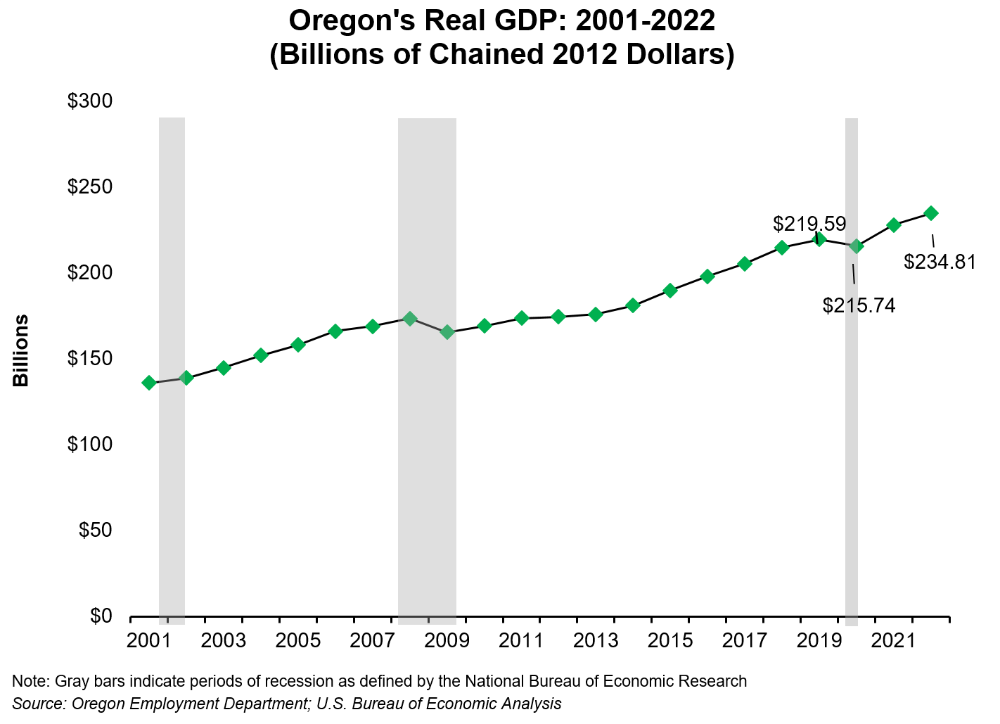
According to the Bureau of Economic Analysis (BEA), Oregon’s year-over-year change in real GDP has been positive most years from 2001 to 2022 with the exception of the recessionary years 2008 through 2010 and 2020. Following the recent pandemic recession, Oregon had the ninth highest rate of growth in GDP of all 50 states from 2021 to 2022, increasing real GDP by 3.0% and adding $6.8 billion in goods and services to the economy.

Current Real GDP in Oregon
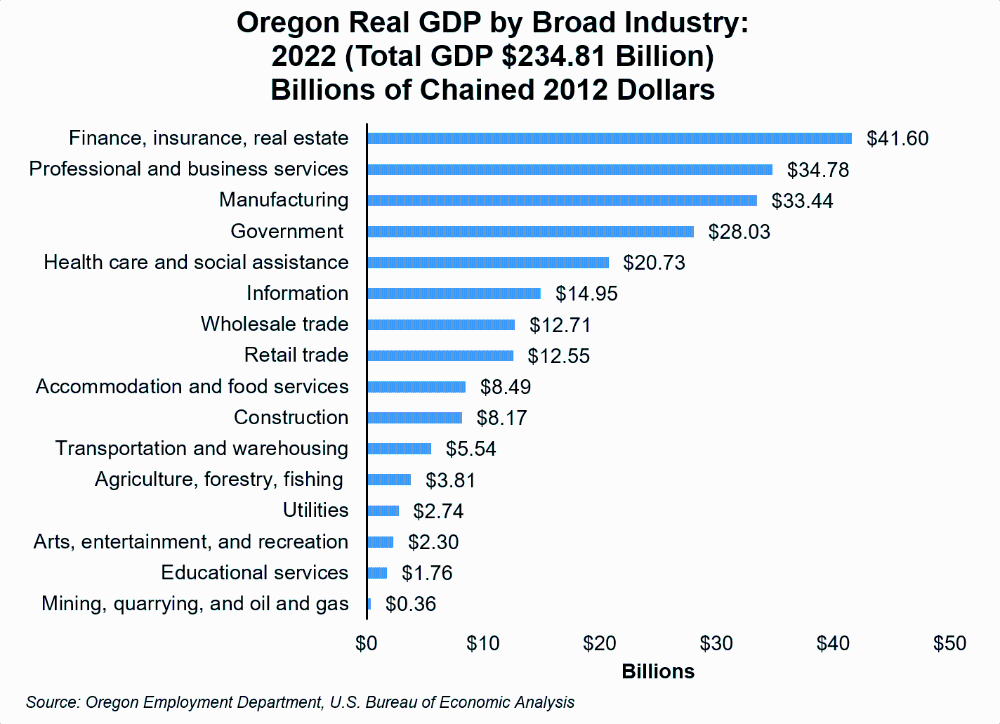
In 2022, the real GDP in Oregon reached $234.81 billion in U.S. dollars. This is an increase of $6.8 billion from the previous year, when the state's real GDP stood at $227.98 billion. The major industries contributing the majority to GDP included finance, insurance, real estate, rental, and leasing ($41.6 billion); professional and business services ($34.8 billion); manufacturing ($33.4 billion); and government ($28.0 billion).

Real Per Capita GDP in Oregon
Per capita GDP measures the economic output of a nation or geographic area per person. It is a good representation of a state’s standard of living and the prosperity of the area’s economy. Per capita GDP is calculated by dividing the total economic output in an area in a given time period by its current population.

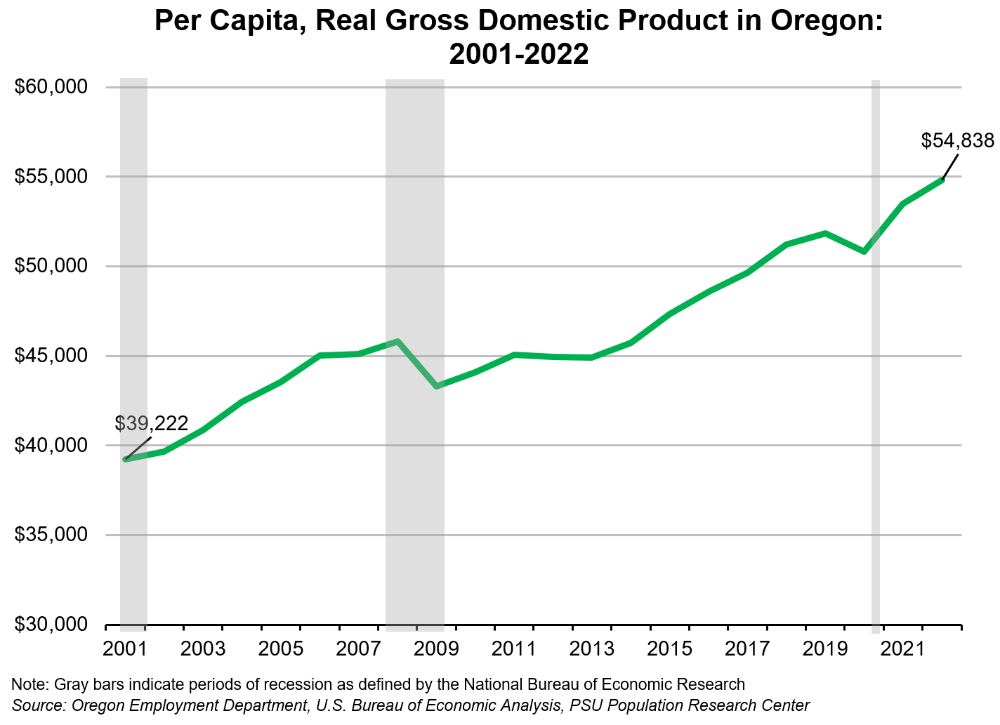
Oregon’s per capita real GDP rose from $39,222 in 2001 to $54,838 in 2022, increasing 40%. Most of this period saw Oregon’s per capita GDP increase year-by-year, except for the two recessionary periods during 2008 through 2010 and 2020.