Salem Covered Employment and Wages
August 28, 2023Covered employment or quarterly census of employment and wages (QCEW) data is obtained through employer’s payroll tax records. The universe for QCEW includes businesses whose employees are covered by unemployment insurance. QCEW provides more detailed industry employment and payroll data than the current employment statistics (CES) employment estimates.
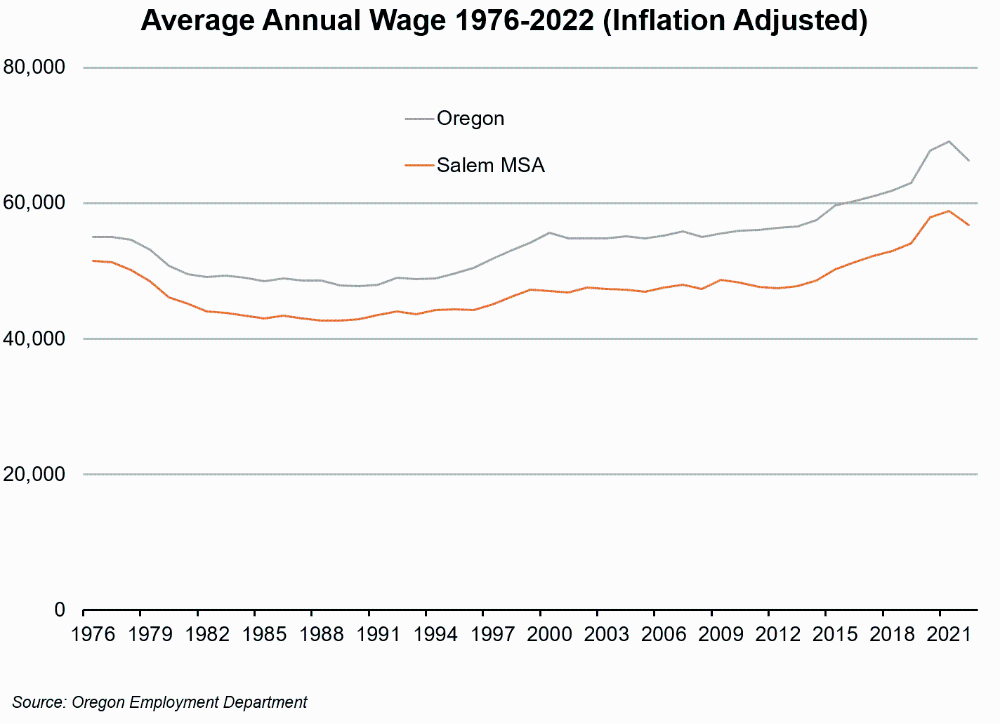
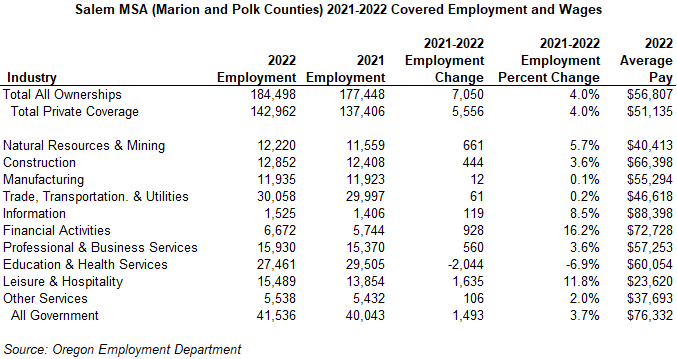
In 2022, total covered employment for the Salem Metropolitan Statistical Area (MSA), which is comprised of Marion and Polk counties, was nearly 184,500; up more than 7,000 jobs from 177,448 in 2021. The annual average wage in the Salem MSA was $56,807 in 2022, less than the statewide average of $66,342.

Marion County’s average annual wage in 2022 was $58,072 which ranked it ninth highest among Oregon’s 36 counties. Polk County’s average annual wage in 2022 was $47,175; ranking 28th among Oregon’s counties. The Salem MSA’s average annual wage has consistently been less than the statewide average over the past 40 plus years. However, the gap has increased over the years. In 1976, Oregon’s average wage was a little less than 7% higher than the Salem MSA’s average. By 2000 the statewide average wage was 18% higher than in the Salem MSA. Following the “dot com” bubble burst the wage gap between the mid-valley and the state narrowed slightly. However, that gap grew worse beginning in 2010 and continuing to 2016, when the statewide average wage was nearly 19% higher. That gap has narrowed slightly in recent years. In 2022, the statewide average wage was a little less than 17% higher than the Salem MSA’s average.
Employment Gains and Losses in 2022
The QCEW series provides us with the changes in employment and also allows us to see if those employment gains and losses are occurring in industries with high or low average wages.
The Salem MSA gained more than 7,000 jobs from 2021 to 2022. Gains of more than 5,500 in the private sector accounted for the majority of the growth, while public-sector growth was slightly slower, adding nearly 1,500 jobs. Employment gains and losses varied significantly by industry.

Leisure and hospitality (+1,635 jobs) and financial activities (+928) added the most jobs during 2022. Financial activities also showed the fastest industry employment growth in the Salem MSA, growing 16% in 2022. Leisure and hospitality had the second fastest growth, adding nearly 12%.
Natural resources and mining was the other major sector to show strong employment growth in 2022, adding more than 650 jobs (+5.7%). Natural resources and mining employment in the Salem area is dominated by agriculture, in particular crop production, and logging as well.
Manufacturing showed relatively flat employment growth in 2022, adding 12 jobs and growing 0.1% during the year.
Private-sector education and health services was the only major sector to show an employment decline in 2022; shedding more than 2,000 jobs in the Salem area.
The public sector as a whole showed 3.7% employment growth from 2021 to 2022, adding a little less than 1,500 jobs.
For more detailed industry employment and payroll data go to QualityInfo.org, under “Tools” select “Employment and Wages by Industry (QCEW)”. Covered employment and payroll data is available for Oregon’s counties from 2001 to the present.